
‘Straight and crooked thinking’ by Robert H. Thouless, first published in 1930, is a great little book that helped me recognize a range of common reasoning errors, avoid them in myself, and counter them in others. Some of the errors are genuine mistakes, others are sophistry – saying anything to get your way – while others are a muddle of the two.
The book's great strength is that it identifies and names errors that are specific and easily recognized. It also explains them well and illustrates them with many examples. This web page uses the same approach to highlight the many errors people make when dealing with uncertainty, either:
Muddled thinking about uncertainty is something most people encounter frequently, from worries about health risks to messy and stressful arguments about business decisions. Typically, uncertainty increases the stress you feel and your chances of being wrong. When you're sharing decisions with other people the problems of stress and muddle are far greater. If you have ever been in a meeting about budgets you will know what I mean.
I don't think anybody has found the right way to think about uncertainty, but some things are clearly mistakes we can learn to avoid. I hope you find at least some surprises in this article.
Can we think of everything? This question has been answered in convincing theory by Nobel Prize winning economist and psychologist, Herbert A Simon, with his theory of bounded rationality. The answer is ‘No’.
Simon showed that even imaginary problems, free of the messy complexities of real life, quickly create computational tasks that would keep the fastest imaginable computers busy for longer than the expeced future life of the earth. Throw in the complexities of real life and we haven't got a hope.
Even without theory, it's obvious that today's fast moving, complex world is a confusing, chaotic mess. Some of its problems people solve, but many defy solution, with one well-meaning change after another failing to work.
Even if we had lots of reliable, accurate information to work with we don't have time to use it properly. But anyway, we don't have good information to work with. Apart from the evidence of our own eyes and ears we rely on a great deal of hearsay (including journalism, friends, work colleagues, and so on), often based on partial information, and yet more hearsay.
Many of the things we regard as ‘common sense’ are no better than dubious received wisdom. Attractive, compelling, but totally wrong beliefs circulate the collective human mind like viruses.
More recently, chaos theory has clarified why some things are extremely hard to predict with certainty – impossible in practice. Some things are extremely sensitive in a particular way. Their behaviour evolves in radically different ways as a result of tiny differences in their starting state. The weather, for example.
I'm not saying that nothing is certain, nothing is predictable, and nothing can be done to solve our problems. But I am saying there are some pretty big limitations we need to be aware of.
The following are all common reasoning errors resulting from not understanding, or choosing to ignore these limitations:
Some philosophers have argued that nothing is truly certain, but holding to this approach through daily life soon gets tiresome. There are lots of things we can be so confident of that assertions of complete certainty are usually reasonable. But there are also many things where absolute certainty is not reasonable.
Here are some examples to illustrate:
Example: ‘The sun will rise tomorrow.’
Complete certainty: Reasonable (for the time being, and not forgetting the hazards of black holes and asteroids).
Example: ‘Gravity will keep on working this afternoon on earth.’
Complete certainty: Reasonable, but beware of very precise predictions about its strength.
Example: ‘These proposals are popular/unpopular with staff.’
Complete certainty: Unreasonable, unless ‘staff’ consists of one person, the speaker. You can get nearer certainty by asking everyone, but human attitudes are extremely difficult to establish with absolute certainty and change too.
Example: ‘2 + 2 = 4’
Complete certainty: Reasonable.
Example: ‘The restructuring will enable us to focus on our core business and provide the world class services our customers demand.’
Complete certainty: Unreasonable. Management speak often includes unreasonable assertions of complete confidence.
Example: ‘This research shows that people are more stressed now than they were 10 years ago.’
Complete certainty: Unreasonable. Research on human nature is almost never conclusive and the vagueness of the conclusion means it would probably fall apart if analysed critically.
Unreasonable certainty seems to be caused by a number of things, including the effort of holding something in mind as uncertain, the way language tends to favour categories over degrees on a continuum, and the way other people demand certainty from us.
There are at least three ways to use unreasonable demands for certainty to get your way:
‘What do you mean you think they have insurance? Don't you know?’ The demand is used to undermine someone's credibility. Fear of such attacks may be one of the reasons politicians and business leaders make so many statements of unreasonable absolute certainty. They want to look strong and confident. The problem is they can end up looking deluded and out of touch.
‘I want a firm quote and a delivery date, and I don't want any more excuses about your suppliers. Surely you can do that?’ The demand is used to push risk onto someone else. Employers use this method via budgets and personal objectives to push the risk of failure down onto employees. In effect, discussions about targets are the first part of pay negotiations. No wonder they take so long and people strive to get set the slackest targets possible.
‘There's no conclusive evidence that our product harms the environment, and until such evidence is provided we see no reason for making changes whose costs would have to be passed on to our customers.’ The demand is used to avoid having to act. This has been used to argue that smoking isn't bad for you and global warming is not being accelerated or caused by fossil fuel burning.
Honest but mistaken expectations of complete certainty or of a high level of certainty on all things, not just those where it is feasible, are another form of mistake. Sometimes these expectations may have been created when people took seriously the tricks described above. The problems this can cause include:
Mistaken judgements of others: If a person has an unreasonable expectation of certainty of another person he/she may lose confidence in that other person if they do not express the certainty expected. This is a mistake and could lead to well considered analysis and advice being ignored. For example, organizations often lay down requirements for ‘business cases’ to support significant expenditure. The rules about what the business case should cover tend to push for a high level of certainty regardless of the project and how predictable it is. In response, most people wanting funding try to hide their guesses and move quickly on to impressive spreadsheets to avoid being found out.
Delayed action: Trying to get more certainty when it is not feasible to do so in the time available is another possible mistake.
Unrewarded efforts to reduce uncertainty: Where uncertainty can be reduced efficiently it usually should be but it is possible to waste a lot of time trying to reduce uncertainty in situations that are inherently very difficult to predict. It is vital to recognize how predictable different things are.
Not expecting consideration of alternative outcomes: If your expectation is of certainty then you will not expect to have to consider alternative outcomes. You will not require this of others or set aside time yourself to consider those alternatives. When events unfold differently from your expectation you will be unprepared.
Another consequence of bounded rationality is that we can almost never know that we have taken the best course of action. We can find what looks like a better course of action, or select what we think is the best from the plans we have thought of, or keep working on the plan until it seems good enough, but in real life optimization is not possible. Business leaders often say things like: ‘This will enable us to optimize our customer service processes and provide the best rewards for our people.’ This sort of statement is a mistake or a lie.
The previous section argued that in many everyday situations we should think of many things as being uncertain to some extent. Some more common errors arise in this sort of reasoning. Some are the result of the limitations of ordinary language.
Natural language has many phrases for quantifying things. For example, ‘I'm pretty sure it was him’, ‘There were lots of people there.’, ‘It was heavy.’, ‘They often do that, but rarely do this.’ These phrases are helpful and people do have some idea of what they mean but they are not very precise and this can cause problems. Experiments to find out what people mean by various quantitively vague phrases have shown that there is a broad consensus, but it is not exact, and that precise interpretation depends on the situation. For example, ‘I saw lots of snakes on our holiday in Dorset, but hardly any people’ might mean seeing five snakes but only two hundred people.
Quantitive vagueness is a big problem if you need to be precise and worse if you have had to define a phrase specifically for some special purpose such as when discussing a business decision. The two main problems are:
Vagueness as to the boundaries of the range the phrase is intended to indicate. How high is ‘high’? How often is ‘often’? And so on.
Excessive quantization. The categories can cover such a wide range that they are not precise enough for the purpose to which they are being put.
Example: Risk assessment. Various methods of assessing and managing risks in organizations and projects have been invented and many involve assessing risks as ‘High’, ‘Medium’, or ‘Low’. These categories are sometimes defined in a quantitive way using probabilities or frequency of occurrence but this is often missed out. Consequently each person has their own idea of what is meant and this will vary from one risk to another as described above. For example, someone may say there is a high risk of a project being completed later than planned (90% certainty in mind because this is normal for projects generally) and a high risk of the project sponsor being arrested by the police (40% in mind because the sponsor is a notoriously dodgy character making this risk unusually high for this project). It may also be the case that risks put into the same range are actually orders of magnitude different in their likelihood e.g. risk of reactor meltdown might be ‘Low’ and so is risk of industrial action, but the first is 1,000 times less likely than the second. The problems of quantitive vagueness are often compounded by asking questions like ‘What is the risk that sales will be low in the first year?’ which combines the vagueness of risk categories with the vagueness of what ‘low’ means in relation to sales. This kind of thing is usually excused on the grounds that it is ‘simpler’ than using numbers but on that logic the best approach would be not to think at all.
Just as a word can be quantitively vague if not defined with some sensible measurements, so invented numerical scales can be treacherous if not tied to some established measurement system. For example, asking people to rate risks as to likelihood on a scale from 1 to 10 without linking those numbers to probabilities usually causes problems:
For the scale to relate directly and easily to probabilities it would have to be 0 to 10, not 1 to 10.
Many people do not assume that the numbers on the scale are 10 x probability and their ratings can be bizarre. Some people tend to group their ratings in the middle, while others prefer the extremes of the scale. When a group of people is trying to agree some ratings this makes the ratings very confusing. [This can be reduced by mathematically normalizing the spread of each individual's ratings, if each person makes enough of them to get a good idea of their tendencies.]
Ratings of other quantities do not have the advantage of an existing scale i.e. probability, which ranges from 0 (definitely no) to 1 (definitely yes).
Other errors arise when we rely on judgements of quantities such as likelihood, or try to combine those judgements using yet more judgement. This kind of judgement is often necessary in the absence of more objective information, and it is possible to learn to give reasonably accurate probability judgements in a narrow field with long practice, good feedback, and some skill. However, there are also several errors that can undermine reasoning.
This area has been studied intensively for several decades by psychologists. There are many, many scientific articles on the subject and debate about why people make the errors they do is particularly complex and hard to follow. The research has also been picked up by authors who have taken the names of the theories and misunderstood and over-generalized them in a highly misleading way. Instead of leading with the theories and risking over-generalization, I present below some examples of questions used in experiments, the answers people usually give, and why they are wrong.
If you've never come across this research before then prepare your ego for a battering. If you get to the end of these examples and you're still thinking ‘Surely this is some mistake?’, forget it. Thousands of people have been through the same thoughts you are having but there have been so many studies now that you can be pretty confident that anything you can think of as on objection has been tried out and failed. The fact is we're mostly stupid. Get used to it.
Question: Imagine we have a group of 100 professional men, a mixture of 70 lawyers and 30 engineers. Now we select one at random. What is the probability that he is an engineer? Now suppose we are told that the man is 30 years old, married with no children, has high ability and motivation and promises to do well in his field. He is liked by his colleagues. What would you say was the probability that he is an engineer? Finally, we learn that he builds and races model cars in his spare time. What now is your opinion as to the probability of his being an engineer?
Typical answers: Most people answer the first of the three probability questions with ‘30%’, which is correct. Given some information but none that helps decide if the person is an engineer or a lawyer people tend to say it's ‘50:50’. Given some information that suggests an engineer, they give a number derived purely from the extent to which the information seems to represent an engineer rather than a lawyer, without regard to the proportion of engineers in the group. For example, building and racing model cars seems to suggest an engineer to me, so I would say ‘70%’.
Why they are wrong: The first answer is quite correct. The second answer should be the same as the first, but the snippet seems to trigger us into judging probabilities purely on the basis of how much the infomation seems to represent a stereotypical engineer rather than a stereotypical lawyer. The problem is not so much the use of stereotypes but the failure to consider the proportion of engineers in the group as a whole, which is still an important factor when specific factors of the person selected are not conclusive. The third answer should reflect the original proportion of engineers as well as the biographical clues. In this case it should be lower than the answer based just on model cars.
Question: Imagine a town has two hospitals with maternity wards. In the larger hospital about 45 babies are born daily, but in the smaller hospital only about 15 are born each day. Of course about 50% of babies born are boys, though the exact percentage varies from day to day. For a year, each hospital recorded the days on which more than 60 percent of the babies born were boys. Which hospital do you think recorded the most such days?
Typical answers: Most people say ‘about the same’ and other answers are evenly split between the large and small hospital. In other words people generally don't think size matters.
Why they are wrong: Size does matter. An elementary conclusion of statistics is that the larger a sample is the more closely it typically resembles the population from which it is taken. The larger hospital will have far fewer days when more than 60% of babies born are boys. In general people seem to have no concept of the importance of sample size.
Question: Imagine a huge bag into which we cannot see, filled with lego bricks of two colours, blue and yellow. 2/3 are one colour and 1/3 are the other colour but we don't know which is which. One person pulls out five bricks at random and finds 4 are blue and one yellow. Another person grabs a bigger handful at random and has 20 bricks, of which 12 are blue and 8 are yellow. Which person should be more confident that the bag contains 2/3 blue bricks and 1/3 yellow bricks, rather than the opposite?
Typical answers: Most people say the handful with 4 blues and one yellow is more conclusive.
Why they are wrong: Again, sample size matters but is ignored. The actual odds are twice as strong from the larger handful because of the value of a larger sample, even though it does not contain such a high ratio of blue bricks. Furthermore, when asked to give the actual odds people usually underestimate the confidence given by the larger sample.
Question: Here's another question with bags of coloured lego. This time I have two big bags of lego. One has 700 blue bricks and 300 yellow bricks in it. The other has 300 blue bricks and 700 yellow bricks. I select one by tossing a fair coin and offer it to you. At this point there is nothing to tell you if it is the mainly blue bag or the mainly yellow bag. Your estimate of the probability that it is the mainly blue bag is 0.5 (i.e. 50% likely). Now you take 12 bricks out of the bag (without looking inside!) and write down the colour of each before putting it back in the bag and drawing another. 8 are blue and 4 are yellow. Now what do you think is the probability that the bag is the predominantly blue one?
Typical answers: Most people give an answer between 0.7 and 0.8.
Why they are wrong: The correct answer is 0.97. Hard to believe isn't it? Most people are very conservative when trying to combine evidence of this nature. This contrasts with some of the other situations described above where we seem to be overconfident. These were in situations where we had little idea to go on. Here we have all the information we need to come up with a correct probability but fail to. The more observations we have to combine to make our judgement the more over-conservative we are. Another odd finding is that where there are a number of alternative hypotheses and we have to put probabilities on all of them we tend to assign probabilities across the set that add up to more than 1, unless we are forced to give probabilities that sum to 1 as they should. Our ability to combine evidence is so poor that even crude mathematical models do better than judgement.
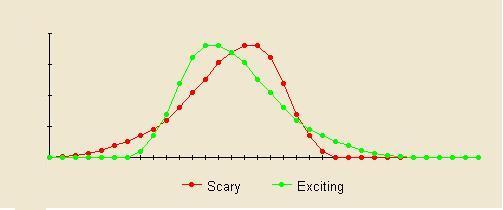
Question: A coin is to be tossed six times. Which sequence of outcomes is more likely: H-T-H-T-T-H or H-H-H-T-T-T ?
Typical answers: The second sequence does not look random so people say the first sequence is more likely.
Why they are wrong: The sequences are equally likely. However, we have definite views about what a random result looks like. We expect it to be irregular and representative of the sample from which it is drawn or of the process that generated it. Since the second sequence violates those expectations it seems less likely.
Question: Write down the results of a sequence of twelve imaginary coin tosses, assuming the coin is fair i.e. heads are as likely as tails.
Typical answers: A typical result looks pretty random.
Why they are wrong: Because people expect the results to look irregular and to be representative of the process that generated them, their sequences tend to include far too few runs and to be too close to 50:50 heads vs tails for a small sample like 12 tosses.
Question: A coin is tossed 20 times and each time the result is heads! What is the probability of tails next time?
Typical answers: Gamblers tend to think that surely it must be time for tails, ‘by the laws of probability’.
Why they are wrong: If you trust the coin the odds are the same as before at 50:50. If there is doubt about the coin then the odds should actually favour another head. Those are the real laws of probability.
Question: Ten trainee teachers each give a half hour lesson which is observed by an expert teacher and a short report is written on the quality of the lesson. You see only the ten short reports and must decide for each teacher where their lesson ranks against others in percentile terms (e.g. are they in the top x% of trainees?), and where they are likely to be after 5 years of teaching relative to other teachers of the same experience.
Typical answers: Most people's ratings of lesson quality and future prospects are basically the same.
Why they are wrong: The ratings of future prospects should be less extreme than the evaluations of lesson quality. Observing a half hour lesson is not a reliable guide to performance in 5 years time! The evidence of the lesson should be influential but not the only factor. Without that evidence you would say their prospects were about average; with the evidence you should say they are somewhere between average and the relative quality of the lesson.
Question: You are a sports coach and want to find out, scientifically, what effect your words have on your coachees. Your records show that when you give praise for a particularly good performance they tend to do less well next time. The good news is that when you give them a hard time for a poor performance they tend to do better next time.
Typical answers: Sadly some people conclude that this shows praise does not work but a verbal beating does.
Why they are wrong: Actually it just means that after a particularly good performance the next one is likely to be less good, and a particularly bad performance is likely to be followed by a better one even if you say nothing. Performance varies, in part randomly, and that is the reason for this.
Question: You have the academic results of two undergraduates for their first year of two different three year degree courses. One has scored six B grades while the other has a mixture of As, Bs, and Cs across 6 papers. Whose eventual degree result after three years would you feel most confident of predicting correctly?
Typical answers: Most people are more confident they can predict the result of the consistent B person.
Why they are wrong: They should have chosen the other person. Highly consistent patterns are most often observed when the input variables are highly redundant or correlated. The straight Bs probably contain less information than the mixture of As, Bs, and Cs.
Question: You listen to someone read out the names of a number of male and female celebrities, some more famous than others. At the end, to your surprise, you are asked to say the proportion that were female. You hadn't been keeping score so have to use your judgement and memory.
Typical answers: People tend to overestimate the proportion of women if there were more big female celebrities than big male celebrities.
Why they are wrong: More famous people are easier to remember so they come to mind more easily. If more of those really big names are female then it influences your judgement much more than the minor celebrities.
Question: Are there more words in normal English text that start with R than have R as the third letter (ignoring words of less than 3 letters)?
Typical answers: Most people guess that more begin with R.
Why they are wrong: But in fact more have R as the third letter, but it is far easier to call to mind words that start with R so we think they are more numerous.
Question: Imagine you have 10 people to choose from to form a committee. How many different committees can you form from this group with 2 members, 3 members, 4 members, and so on?
Typical answers: Since most people don't know the maths to do this they make a judgement. In one study the median estimate of the number of 2 person committees was 70, while the estimate for committees of 8 members was 20.
Why they are wrong: The number of ways to form a committee of X people out of 10 is the same as the number of ways to form a committee of 10 - X people. If you select one set of people for the committee then you are simultaneous selecting the others for the ‘reject committee’. For example, the number of 2 person committees is the same as the number of 8 person committees and is 45. However, as one tries to imagine committees it seems easier to imagine forming lots of small committees than lots of big committees, and so it seems there must be more of them.
Question: You are presented with information about some imaginary mental patients. For each patient you are given a diagnosis (e.g. paranoia, suspiciousness) and a drawing made by the person. Afterwards, you have to estimate the frequency with which each diagnosis is accompanied by various features of the drawings, such as peculiar eyes.
Typical answers: Most people recall correlations between diagnoses and pictures that match natural associations of ideas rather than actual correspondences in the examples given. For example, peculiar eyes and suspiciousness seem to go together and frequency of occurrence is judged high.
Why they are wrong: The illusory correlations are resistant to contrary data. They occur even when there is a negative correlation between diagnosis and feature, and prevent people from seeing correlations which are actually present. Similar experiments have shown that we are surprisingly bad at learning from examples. We do not always learn by experience! Other experiments have shown how hindsight colours our interpretation of experience. We think that we should have seen things coming when in fact we could not have done. Another common and powerful bias is known as the ‘Fundamental Attribution Error’. This is the tendency to explain another person's behaviour as mainly driven by their personality/habits and our own behaviour as mainly driven by circumstances. Both judgements are usually wrong.
Question: Imagine you are asked a series of very difficult general knowledge questions whose answers are all percentages between 0 and 100% (e.g. the percentage of African countries in the United Nations). After each question is given, a sort of roulette wheel is spun to give a number. You are asked if the answer to the question is higher or lower than the random number chosen by the wheel. Then you have to estimate the answer.
Typical answers: Most people's estimates are affected by the number given by the roulette wheel. For example, in one study the median estimates of percentage of African countries were 25 for people given 10 as the starting number, and 45 for groups given 65 to start with.
Why they are wrong: This is called an ‘anchoring’ effect. Our judgements are anchored by the given number, even if it is known to be random, but especially if it is given by someone else we think might know something. We then fail to adjust sufficiently from the anchor.
Question: Which do you think is most likely? (1) to pull a red marble from a bag containing 50% red and 50% white marbles, or (2) drawing a red marble 7 times in succession from a bag containing 90% red marbles and just 10% white (assuming you put the marble back each time), or (3) drawing at least one red marble in 7 tries from a bag containing 10% red marbles and 90% white (assuming you put them back each time).
Typical answers: Most people think drawing 7 reds in succession is most likely, and at least 1 red in 7 tries the least likely.
Why they are wrong: In fact the probabilities are very similar, but the reverse of what most people think: (1) = 0.48, (2) = 0.50, (3) = 0.52. This illustrates our general tendency to understimate the likelihood of something happening at least once in many tries, and overestimating the likelihood of something likely happening successively. For example, we might look at the many risks affecting a project and see that each alone is unlikely. Based on this we tend to think there's little to worry about. In fact, because there are lots of unlikely risks, the risk of at least one thing going wrong is much higher than we imagine.
Question: You are asked to make some predictions about the future value of the FTSE100 index. For a given date you are asked to say a value that is high enough that you are 90% sure the actual index will not be higher, and another number so low that you are 90% sure the actual index will not be lower.
Typical answers: Most people are too confident of their judgement for a difficult estimate like this and their ceiling is too low while their floor is too high.
Why they are wrong: Actually there are various ways to find out what a person thinks the probability distribution of some future value is. Different procedures give different answers and an anchoring effect from the first numbers mentioned is quite common.
Another mistake is to ask people to give a single risk rating for risks that might happen more than once. For example, ‘What is the risk of billing error?’. For a large company issuing millions of bills a year it is virtually certain that they will make at least one error at some point. It is necessary to consider the probabilities in a different way. In theory, we need a probability for every number of billing errors they might make. Ratings can be simplified but, essentially, we need a distribution of probability against frequency.
Another common error when asking people to rate risks is to ask for a rating of ‘impact’ when the impact is variable. For example, ‘What would be the impact of a fire at our main data centre?’ is impossible to answer sensibly with a single number. How big is the fire? What does it destroy? Clearly different fires can occur, and the probability of fires with different impacts is also going to vary.
One of the most difficult analyses is to work out the impact of risks that are not independent i.e. the occurrence of one affects the likelihood that others will occurr. They may be mutually incompatible, or perhaps part of a syndrome of related risks that tend to occur together. This is a big problem, as so many of the risks we face are far from independent. For example, you might list the risks of a project and write down the likelihood of each occurring. But what assumptions do you make about the occurrence of the risks in combination? Were those probabilities on the assumption that nothing else has gone wrong? In practice, once a project starts to fall apart it's in danger of a downward spiral in which the distraction of fighting one fire sets another alight.
There are two related errors: (1) forgetting about previous evidence when drawing conclusions from new evidence, and (2) not recognizing that initial beliefs exist, even before the first evidence is received. When trying to judge the likelihood of something from inconclusive evidence we need to combine whatever evidence we have. Bayesian probability theory explains how this should be done. First, we need a set of hypotheses about what the truth could be and, for each one, a view as to its likelihood of being true. There is no stage at which we have no idea of the likelihoods. We always need to have some belief, even if it is a complete guess and we start by assuming that all hypotheses are equally likely. (In non-Bayesian statistics this is hidden because the initial view is not explicitly stated.) When new evidence arrives we need to modify our beliefs by combining what we believed before with the new evidence. (Bayes even found a formula for doing this mathematically which is extremely useful and can be found in any good textbook of probabilities.)
Example: Appraising performance of colleagues at work. Imagine you are a manager in a large company and every year have to go through the painful process of trying to evaluate the performance of people who have worked for you and for others from various sources of evidence. (Perhaps you don't have to imagine it.) Suppose that this year Personnel have said everyone will be given a performance rating of 1, 2, 3, or 4 with 4 being the best rating. The idea is that 25% of the staff in the company will end up with each rating. As each staff member is considered various written appraisals and performance statistics are read out and the committee of which you are a member has to arrive at a judgement of what rating to give. Here's how to analyse this task in Bayesian terms. For a given staff member, Anne say, the hypotheses are (a) Anne is truly a 1, (b) Anne is truly a 2, (c) Anne is truly a 3, and (d) Anne is truly a 4. The initial probabilities of each hypothesis are each 0.25 because that is really how Personnel have defined the scale. Imagine that the first evidence read out is a punctuality statistic. How likely is it that the statistic read out for Anne is the punctuality of a 1 person, a 2 person, and so on? Imagine it is more the punctuality of a 1 person, now your views should update to show that hypothesis (a) is the most likely, probably followed by (b), then (c), then (d). The next evidence is a customer feedback survey where the results are more those of a 2 rated person. Now your probabilities for each rating being the one truly deserved shift again, perhaps making 2 the favourite, or perhaps staying on 1 depending on the precise probabilities involved. This process continues until all evidence has been heard.
Incidentally, research shows that humans are very bad at doing this kind of evidence combination by judgement alone. A better way would be to use a simple mathematical formula to combine the individual ratings and judgements using Bayes' formula. Another alternative is to use a simple linear function something like this: overall score = c1 × s1 + c2 × s2 + c3 × s3, where c1, c2, and c3 are constants and s1, s2, and s3 are scores from three separate sources of evidence, such as punctuality, customer feedback, and average rating from peers. The s1, s2, and s3 scores should be ‘normalised’ so that they have the same distribution as each other. For example, it would be distorting if punctuality scores varied from 1 to 3, but customer ratings varied from 1 to 300. We need to get them all onto the same sort of scale so their relative importance is determined only by the constants. Provided the individual scores always move in the same direction as the overall score (e.g. better punctuality always means a better overall score) then this sort of formula consistently outperforms human judgemental combination of evidence even if the constants are chosen at random! This is because we are bad at this and linear combinations are very ‘robust’.
Another key point from Bayesian theory is that the set of hypotheses which we are trying to assess as each piece of evidence arrives must (1) include all possibilities (i.e. no gaps), and (2) include each possibility only once (i.e. no overlaps). For example, if we are trying to decide which of the horses in a race is going to win then the set of hypotheses could be one hypothesis for each horse plus a hypothesis that says no horse wins (e.g. the race is called off or abandoned) and hypotheses for dead heats between various combinations of runners. It would be a mistake to miss out one of the horses by saying something like ‘The question is whether Horsey Lad or Sir Gawain will win.’ or to forget that there might be no winner or a tie. It would also be a mistake to select hypotheses that overlap such as A: Horsey Lad wins, B: Horsey Lad or Sir Gawain wins, etc.
When people are asked to identify risks or uncertainties of a venture they often come up with areas of risk or uncertainty rather than specific risks or uncertainties, without realizing what has happened. (Sometimes it is actually areas that they need to think about rather than specifics, and it is the instructions that are wrong.) For example, ‘regulatory risk’ is not a risk, but an area where there are many risks, whereas ‘Risk that price controls will be introduced this year’ is much more specific and contains a proposition that is either true or false, i.e. ‘Price controls will be introduced this year’.
Studies and personal experience show that when we are unsure of something we are more likely to be influenced by what others seem to think. In a group, the first person to say their view about something uncertain, or the most confident looking person, may be very influential on the eventual group ‘consensus’. Perhaps it is best for someone to speak first saying (confidently) ‘This looks like a difficult judgement, with at least some significant uncertainty, and probably not much hard data to go on. I suggest we all start by just writing down what we each think, why, and what we are most uncertain about, then compare notes.’
Another error common in group discussions is concealed over-generalization. Here's an example to show how it works. Imagine a group of five people in a business meeting discussing the possible need for a change to a product sold by their company. Everyone there has a different role in the company and an unknown number of people actually have no idea if a change is needed or not.
CHAIRPERSON: The next item we need to discuss is whether the System A product needs an improved user interface. Alex, perhaps you could start us off.
[Alex, of course, is the person who wanted this discussed and has already lobbied the chairperson. Alex is involved in sales and the previous week two customers made negative comments to him about the user interface of System A. One customer was particularly aggressive about it, putting Alex under a lot of pressure. That same week, Alex had 17 other meetings with customers at which the user interface was not criticized. Other sales people had a further 126 meetings with customers and nobody in the current discussion knows if the user interface was criticized. What Alex actuallys says is ...]
ALEX (SALES): Recently I've been getting a lot of feedback from our customer base about the user interface of System A. It's not liked at all. I think it could be costing us repeat business.
BOB (ENGINEERING): What's the problem with it?
[The actual complaints were that response time was too long on a particular program, some numbers important to that particular customer could not be analysed in a particular way, and the customer wanted some money back over a training session that never took place. The customer summed these up by referring to the ‘user interface’ although in fact none of these would be solved by better usability. The customer's generalization of the problem is the first example of concealed over-generalization in this sequence. The next was Alex's overstatement of the customer feedback, referring to ‘a lot’ of complaints instead of stating the number, from the ‘customer base’ but without naming the customers, and repeating the customer's mis-naming and over-generalization of the problems. What Alex actually says is ... ]
ALEX: It's basically clunky and old fashioned. We haven't really done anything with it for three years!
The discussion then moves on to an argument about whose fault it is, effectively assuming the existence of the problem without further thought. Eventually the chairperson intervenes with ... ]
CHAIRPERSON: OK, OK, why don't you and Alex take that off line. I think we're agreed that we need to improve the System A user interface so I'll feed that back to the product board.
[The chairperson's summing up completes the sequence of delusion by generalizing from the heated argument of two people to a general agreement that the user interface needs an overhaul.]
None of these generalizations are made deliberately or with any consideration of uncertainty. Hence, I call them ‘concealed’.
It's common for someone to suggest that there are lots of something and give an ‘example’ which in fact is the only known instance.
This kind of thing is so common it's difficult to imagine escaping from it. What should the chairperson say? Obviously, it is wrong to generalize from a single example, but it is also wrong to dismiss such evidence as inconclusive and therefore worthless or meaningless. In practice, one reason people tend to read so much into insignificant data is that they have reasons to believe the examples are part of, perhaps the first sign of, a significant trend. The reasons may or may not be good ones, but they need to be considered alongside other evidence. This requires evidence to be integrated, which we don't often do well. Here, at least, is a better approach to Alex's customer problem.
CHAIRPERSON: The next item we need to discuss is whether the System A product needs an improved user interface. Alex, perhaps you could start us off.
ALEX (SALES): Recently I've been getting a lot of feedback from our customer base about the user interface of System A. It's not liked at all. I think it could be costing us repeat business.
CHAIRPERSON: Can you be specific about the feedback? Who gave it and what did they say?
ALEX: Errr. The companies were Delta Ltd and Beta Ltd. Delta gave me a really hard time over the reporting.
CHAIRPERSON: What specifically?
ALEX: They said it wasn't user friendly.
CHAIRPERSON: Do you know what that view was based on? Did they have any specific complaints?
ALEX: Well, er. The main thing was report 101, which they wanted analysed by the day of the week. I said they could run it for individual days and put the results together on a spreadsheet, then the guy just got stroppy.
[More questions from the chairperson are needed to get all the specifics, then ... ]
CHAIRPERSON: [summing up] So, from those experiences we have a suggestion of problems with report 101, enquiry 33, and the script in module C. We don't know what other complaints there may have been about System A in its current version. On that basis alone we only have reason to consider modifications to those three elements, but it's interesting that one customer described these as user interface flaws, which may indicate other issues not made clear in Alex's meeting. Do we have any other reasons for suspecting that System A's user interface is a problem?
JOHN (ENGINEER): We never tested it. We haven't done that for any of our products.
JANE (FINANCE): What do you mean we never tested the user interface? Surely we test all our systems don't we?
ALEX: No wonder they're complaining.
JOHN: No, no. That's not what I mean. Of course we tested it to make sure it didn't have bugs in it and met the functional requirements, but we never did usability testing specifically to find out if the thing was user friendly. Our larger competitors do it, but we just didn't have time.
ALEX: But surely we had users involved. How much difference would this usability testing have made?
JOHN: A big difference. It's another level of design.
CHAIRPERSON: So are you saying that System A's user interface is likely to be significantly less user friendly than the competition?
JOHN: Yes.
Some judgements about the future depend on fine judgements of quantities and combinations of them. Decisions about personal finance and about the environmental impact of an activity are good examples. Typically, faced with a decision about pension contributions, or insurance, or mortgages, most people go through some futile reasoning about whether something is taxed or not and perhaps remember to ask about charges and penalties. However, in the end there is no way to know the value of a financial deal without calculation. Similarly, environmental impacts are so diverse and the indirect impacts so numerous and hard to discount safely that only rigorous modelling and calculation has any chance of being reliable.
Many attempts to analyse risk rely on asking people to give separate judgements about the likelihood of something happening, and the impact if it happened. In addition to the other common problems already described it is my impression that people often cannot entirely separate the two.
This may be just the result of all the other problems. Perhaps people simply fudge the ratings to give an overall impression of the importance of a risk. For example, rating the impact of ‘a fire at our data centre’ is impossible to think through clearly. What is the extent of the hypothetical fire? What is damaged by it? What assumptions should be made about fire fighting and standby arrangements? Most people would feel this was an important risk and use whatever system of judgements they were asked for as a way of saying so.
In view of the many problems with judgements it is often necessary, for important decisions, to use calculation. This is a great step forward from unsupported judgement but, of course, introduces a further range of errors.
Maths is one of those school subjects that just a few people like and succeed at but which most people hate and struggle with. Within a few weeks of stopping study of maths it is very difficult to remember, especially if it never made perfect sense to you in the first place. Even the bright financiers who build huge computer models to support multi-billion pound lending decisions make mistakes – lots of them.
The mathematical models that mathematicians have chosen to develop and explore down the centuries have been influenced by a natural desire to keep things simple, short, and easy to calculate. This was especially true before computers came along, but is still a factor now. More importantly, most of the most famous models have pre-computer origins and trade realism for ease of working in a way that is no longer necessary.
As a result the best known, most often used formulae are sometimes not a good fit to reality.
The usual measure of spread of a distribution (e.g. the height of children in a school) is its variance. This is found by squaring the difference between each data point (e.g. the height of a child in the school) and the average of all the data points. The advantage of squaring the difference is that all the resulting numbers are positive. If you just used the difference between each data point and the average, some differences would be negative numbers, which is a problem. This could be overcome by just taking the absolute value of the differences (i.e. ignoring the minus sign) but absolute numbers are hard to do algebra with so squaring won.
[That's an over-simplification: squaring was initially adopted because, when making estimates of a physical value from unreliable measurements, and assuming the measurement errors are normally distributed, minimizing the sum of the squared differences gives the best possible estimate. However, in the 20th century it was realized that if the distribution is not quite normal the advantage of squaring quickly disappears. By that time, however, squaring was almost universal and had been applied in other situations as well. I think the elegance of the algebra was a major factor in this.]
One effect of squaring is to make data points a long way from the average more important to the overall measure of spread than data points closer to the average. There's no reason to think they are more important and some statisticians have argued that they should be less important because data points a long way from the average are more likely to be erroneous measurements.
(Using the standard deviation, which is the square root of the variance, makes no difference to this. The relative importance of individual data points to the measure of spread is the same as for variance.)
In financial risk modelling it is standard practice to define risk as the variance of returns. This means it is subtly distorted by the effect described above.
However, there is an even more damaging problem with this, since it almost always amounts to an assumption that the distribution of returns is symmetrical about the average, not skewed.
Almost all the equations in finance today incorporate this assumption. But consider two skewed distributions of money returns, one of which is simply the other spun about the average. They have the same average and variance, but which would you prefer to invest in? One is like buying a lottery ticket, with a thrilling upside; the other is something like dangerous sport played for money – modest payoff normally and with a slight chance of being killed.
Sometimes a calculation is made from a model and the result depends a great deal on one or a few factors put into the model but this sensitivity is not noticed. It may be that these factors are actually difficult to estimate accurately. In other situations it may be that some factors that are hard to estimate are not a problem because the overall result is not sensitive to them and even a large estimation error would make little difference to the overall conclusion. These things have to be searched for. The standard method for this is ‘sensitivity analysis’ which considers each element of the model in isolation to look at the difference a small change would make. This is better than nothing but vulnerable to sensitivity to combinations of parameters that move together because they are not independent.
The name of this error was coined by Professor Sam L. Savage, whose website is easy and fun as well as very useful. It refers to the common misconception that business projections based on average assumptions are, on average, correct. For example, suppose you work in an organization for scientists that puts on conferences. Each conference attracts an audience, but you don't know until quite near the date of the conference how big the audience will be. Long before that time you have to book a venue and put down a large non-refundable deposit. Occasionally, conferences are called off because of lack of interest, but you don't get your deposit back. The flaw of averages would be the assumption that you can forecast the financial value of a conference from just the ‘average’ or expected audience. This might be wrong sometimes, but on average it will be right and lead to correct decisions about whether to try to put on a conference or not. As Professor Savage explains, this is only right in those rare cases where the business model is ‘linear’. In this instance the model is not linear and the non-refundable deposit is not considered if the conference it profitable with the expected audience.
No theory of how to get things done has had more impact on personal and business life in the last fifty years than a particular mix of control theory and pseudopsychology that I know you will recognize immediately. The theory goes that the best way to get things done is to set clear and specific goals up front, backed up by clear milestones, monitor your progress against them, and take corrective action when actual achievement deviates from your plan. It is usually linked with the belief that setting aspirational goals is good, and that positive thinking is better than negative thinking. ‘Focus on success’ and keep using feedback until you get it.
This appears in various forms including budgetary control, management and control of projects, and advice on how to achieve success in life, boost your motivation, win at sport, and so on. There's even been research that seems to show that optimists are happier and healthier than pessimists, even though the pessimists are more often right. (Optimists are people who tend to think things will turn out well, while pessimists tend to expect things to turn out badly.)
And yet, despite the enormous popularity of these ideas and their status as ‘good management common sense’, I will show that they are associated with a series of damaging errors in reasoning about uncertainty. Some of these are so serious, and so common, that they amount to a strong case against this whole approach.
As someone with an education in science, mathematics, and logic I sometimes forget that there are many people who deliberately cultivate beliefs they also know to be distortions of the truth. Here are some of the errors of that type:
Pessimism is the tendency to expect bad outcomes and to think about them disproportionately. It may be adopted as a way to avoid disappointment but is usually more likely to predict the future correctly than its opposite, Optimism. We have already seen how people tend to underestimate the variability of outcomes, such as the value of the FTSE on a particular day. The Pessimist is someone who does this and also tends to expect bad outcomes. Faced with a proposed course of action the Pessimist sees only problems and downside risks and expects failure or at least a poor result. The Pessimist, therefore, is reluctant to act since nothing will be achieved anyway, and fails to anticipate, encourage, and exploit opportunities.
Optimism is the tendency to expect good outcomes and to think about them disproportionately. It may be adopted as a way to avoid unpleasant thoughts or, more often, out of a belief that Optimism is good, creating enthusiasm, ‘self confidence’, or mobilizing the mind, perhaps unconsciously, to move in the direction of success. Think about good things and they are more likely to happen, goes the theory of positive thinking. Some believe that visualizing success is a good thing to do, while visualizing failure should be avoided. Like the Pessimist, the Optimist has too narrow a view of future outcomes but also tends to expect good outcomes. Faced with a proposed course of action the Optimist sees only advantages and opportunities and expects success. The Optimist, therefore, is reluctant to think about risks that might jeopardize success or do anything about them. He/she will continue with a venture long after a rational person would have abandoned it as a bad bet. Optimists may be happier and healthier than others but not necessarily as successful, and the consequences of their faulty decisions may well contribute to the unhappiness and ill health of others.
Optimism in groups extends the philosophy of positive thinking to group behaviour. In a group dominated by this theory anyone who raises downside risks or otherwise appears to be thinking ‘negatively’ will be disapproved of and may be regarded as not a ‘team player’. A group thinking this way may suppress uncertainty, fail to manage downside risks, and resist admitting failure until it is long since obvious to others.
The alternative to these views might be called Rational Uncertainty Management. Rational Uncertainty Managers consider the full range of outcomes and have reasonable expectations about the likelihood of their occurrence. They take action to make good outcomes more likely and prepare to exploit them fully if they occur. They also take action to make bad outcomes less likely and prepare to minimize the damage if they should occur. If the odds really don't justify continuing with something, they stop – after the Pessimist, but before the Optimist.
The Rational Uncertainty Manager benefits from better decisions flowing from a much more realistic view of the future without the lethargy of the Pessimist. This approach natually promotes taking action rather than being passive.
Example: Imagine a long distance running race. You are in fourth place and some way behind the person at number three. You're in pain and tired. Someone who believes in positive thinking would need to convince themselves that they were definitely going to get into the top three in order to justify making that effort. With an optimistic attitude they might succeed in convincing themselves of this and pick up speed to catch up the runner ahead – at the risk of exhausting too early and dropping places, which is a risk they prefer to ignore. The pessimist would hang back and concentrate on keeping ahead of the person behind. The Rational Uncertainty Manager would recognize that the outcome is uncertain. Runners ahead could be about to reach exhaustion or suffer injury. Your own resources may be greater than expected – or lower. The most likely outcome may be fourth place but there is a reasonable chance of doing better. Despite the pain and fatigue you know you are not in imminent danger of injury and, since you have nothing to do that requires great physical effort over the next few days, you could exert yourself to complete exhaustion without penalty other than the discomfort at the time. If the chance of a better position justifies the discomfort you press on, adjusting speed based on the risk of exhausting too early or not fully exerting.
It helps to be able to distinguish between better and worse outcomes. However, this idea is often over-extended to a belief in the special value of ‘specific’ objectives/goals/targets/budgets set at the outset of a venture, leading to a number of errors:
Distorted relationships between outcomes and utility: There are many ways that the value (aka utility) of different outcomes varies. Sometimes only a very specific outcome is useful and anything else is not. In other situations, utility varies more gently. For good decision making it helps to try to get the most accurate view possible of the value of different outcomes. Mistakes can be made when the relationship between outcomes and utility is distorted.
Many people believe that ‘specific’ objectives are important, even essential. For example, saying ‘We'd like the company to grow this year’ is not considered as good as ‘We aim to grow the company by 5.5% by 31 March 2003.’ This tends to create the view that growth of 5.5% is success and highly valuable, growth of just 5.45% is failure, and not nearly so valuable, while growth of 7% is not much better than 5.5%. This is reinforced if the target is used as the trigger for payments of money or other rewards to employees. However, in a situation like this it is unlikely that this variation in utility with outcomes is realistic and such targets can easily lead to poor decisions. For example, ‘We've no chance of reaching budget this month so let's forget it and go to a conference.’ or ‘We've already reached our target for the year so let's relax for this month.’ More subtly, a plan might be drawn up specifically to reach a particular specific outcome but in such a way that the plan is brittle, achieving the target or collapsing and achieving very little.
Overstating the certainty behind goals: It is often very difficult to say in advance precisely how you will value a particular future outcome. Fortunately it is rarely necessary and looser statements about objectives are quite adequate for many purposes. A mistake is to make a very specific objective when there is little certainty about what the objective should be. It is better to reflect the uncertainty in the objective and encourage reconsideration as more information becomes available and more thinking is done.
Premature decisions: Setting a specific goal early on can lead to premature decision making. With most decisions, one of our options is to defer a decision and wait for more information or for conditions to change. (In ‘real options’ theory this is called a ‘wait option’.) There are many ways we can benefit from deferring decisions or doing things speculatively so that if events unfold in different ways we will be well positioned. A premature decision is like throwing away the value of that option.
Confusion between plans and forecasts: The word ‘budget’ is a source of much confusion. Is a budget a plan or a forecast? Many people appear to think they are both, and that may be the case at the moment the budget is made. However, as soon as time has passed and uncertainty has done its work the budget should be superceded by a more up to date forecast, and now the confusion often begins. It is important to be clear about the difference between plans and forecasts, and to recognize that forecasts are needed.
Reasoning from outdated goals: Goals are not sacred. Setting a goal is a technique for making and communicating plans. One hypothesises that achieving some outcome (not necessarily very precisely specified) would be beneficial and tries to think of a way to bring about that outcome. As time goes by, conditions change, more is learned, and it may emerge that the benefits of the outcome are not what was expected initially, in which case it is time to reconsider.
Unfortunately, many people do not accept that goals should change and continue to reason from goals set some time ago that have since been outdated and should have been revised. Examples are:
Judging the success/failure of a venture by comparison of actual results with the original targets or expectations. This is almost certain to be inappropriate as few worthwhile ventures are so simple and so brief that the original targets are still relevant.
Judging a person's performance by comparison of actual results with the original ‘agreed objectives’. This is a more complex example since there is also a difference between the conditions assumed at the beginning of the year and those that actually applied. Someone may have performed brilliantly against unexpectedly difficult circumstances and achieved less than the original target.
Deciding to rethink a plan or reallocate resources because actual results have diverged from original expectations. It is more rational to rethink or reallocate when conditions change.
Tedious comparisons of actual financial results with original budgets, often long after the budgets have become meaningless, and often despite the original budgets being little better than guesswork or wishful thinking.
It makes more sense to revise one's ideas about what is valuable and use these as the basis for judging success/failure. We can then compare these with the original target to learn about our abilities to forecast.
Committing prematurely to the wrong goals: In some situations it is not sensible to have a specific goal to which you are committed. Instead, it can be more effective to have identified a number of things that would be desirable if the opportunity arose. Quite often we need to go into a situation and see what might be in it for us. For example, Neil Rackham's research on negotiation and sales showed that more effective negotiators and sales people prepare for a variety of outcomes. The best sales people have more than one objective from a sales meeting and adjust their expectations and goals during the meeting depending on how things turn out. The best negotiators think of lots of things to ask for so they can be flexible in the face of resistance to some of their requests. Insisting on a specific goal in these situations is ignoring the true uncertainty of the situation and detailed empirical studies show it is not effective.
The foregoing points have given a number of reasons why monitoring progress against a plan may not be a rational way to think about uncertainty. However, there are yet more.
False assumption that a corrective action exists and can be found: The theory of control against a target or plan assumes that a ‘corrective action’ exists and can be found to bring actual results once more into line with the plan. However, in some situations this assumption is not correct. Many projects are constrained by a deadline, resource constraints, and quality requirements. If there is a departure from the plan then there is nothing to trade to get back on track. For example, if you are falling behind you can't put more people on the task because that would cost more money so putting the costs over budget. Furthermore, in some real life situations the first departure from plan is a foretaste of what is to come since it indicates that, generally, conditions are proving more or less favourable for the project than was expected.
Delayed action: A simple but fundamental problem with feedback from actual results is that it is often too late to be useful. The time to rethink is the moment news is received of some change in conditions or risks, not the moment when that change eventually feeds through into measurable problems. Overconfidence in the power of negative feedback loops (as they are known in control theory) can lead to failure to search for and monitor news of events relevant to the project or operation and to act quickly on them. It is like driving a car with your eyes fixed on the mileometer. It is much safer to drive with your eyes looking out of the front windscreen at the road ahead. Business leaders should spend a lot of time looking at the road ahead and forecasting in detail the implications of what they see in order to detect conditions which are outside the capabilities of their companies. For example, to meet a raised level of demand with the existing number of packers, or drivers, or pallets, or storage space, and so on.
It makes more sense to evaluate progress against your current view of what outcomes are valuable and what the goals should be.
Crooked thinking about uncertainty is a huge subject and these pages have just skimmed over a number of the most common and damaging types. Almost every topic really deserves a detailed examination on its own. I hope I've caught you out at least once and given you something to think about. If you're involved in management control, corporate governance, personnel, public relations, decision making of almost any kind, financial modelling, or any of the other specific activities I've discussed you have either made some of these mistakes or you have a friend who has.
Acknowledgements: I would like to thank all those who have read this page and commented. I consider every point carefully and often make improvements as a result.
About the author: Matthew Leitch has been studying the applied psychology of learning and memory since about 1979 and holds a BSc in psychology from University College London.
Words © 2002 Matthew Leitch